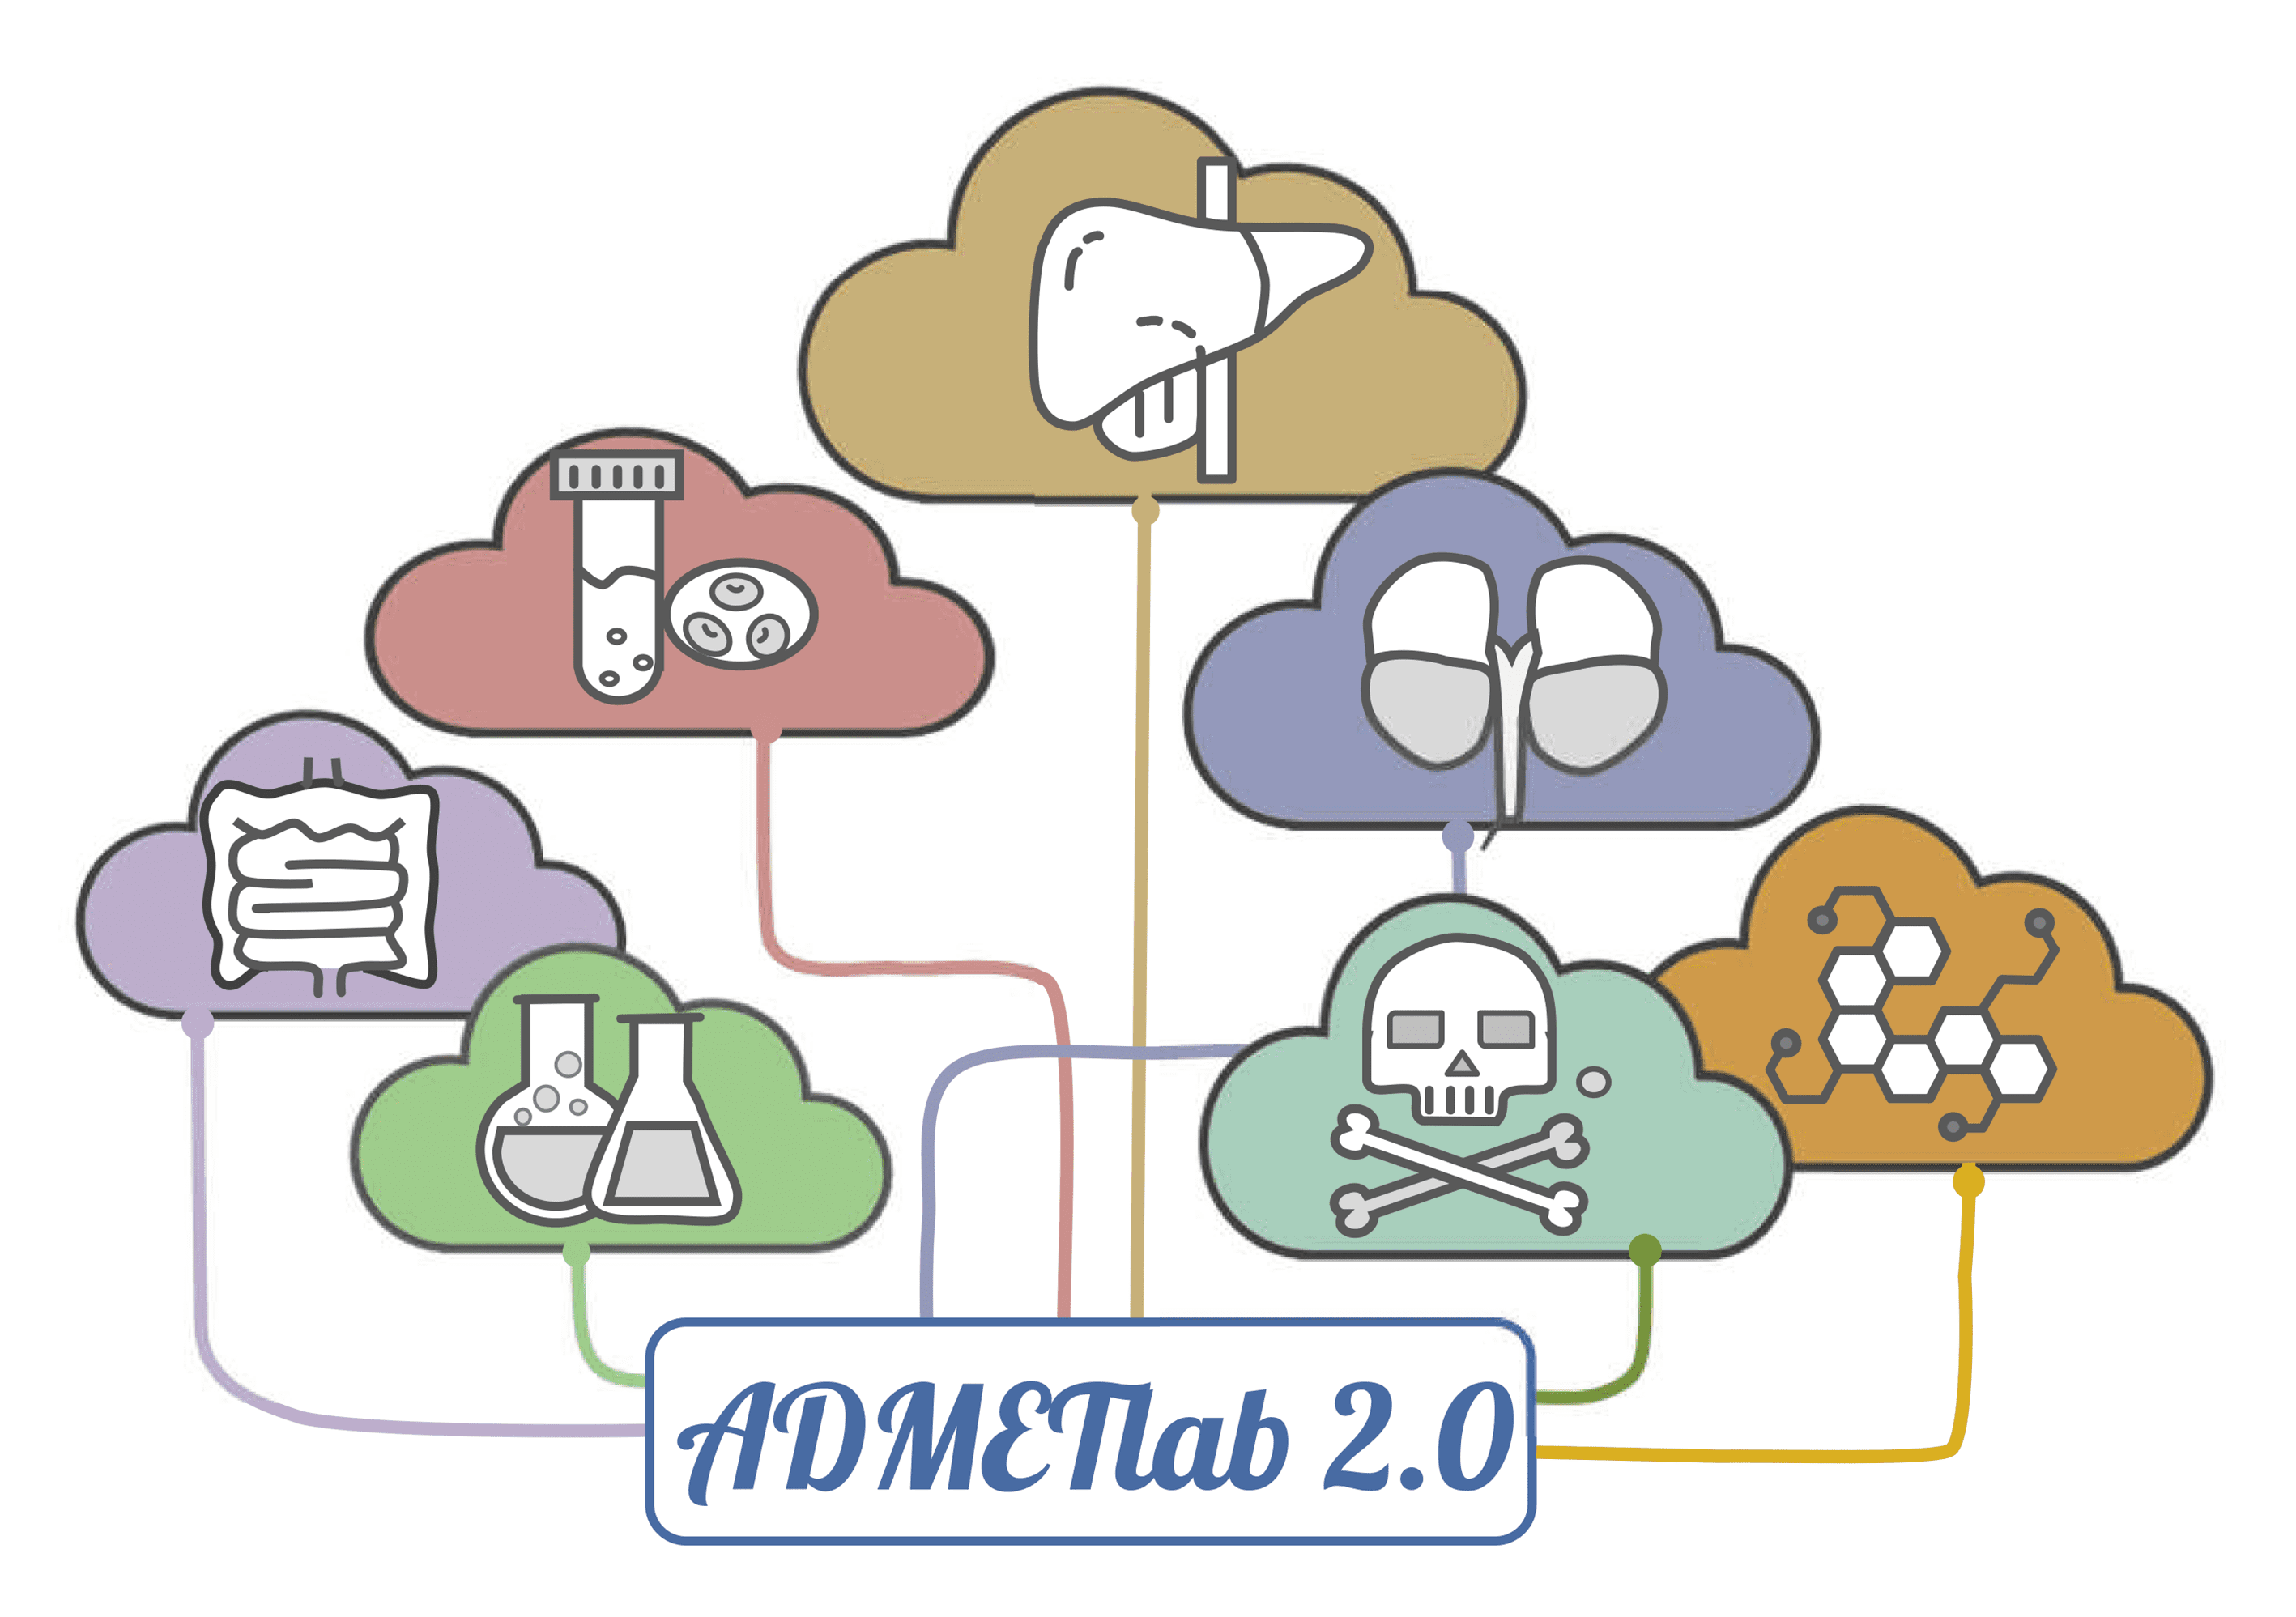
ADMET Evaluation

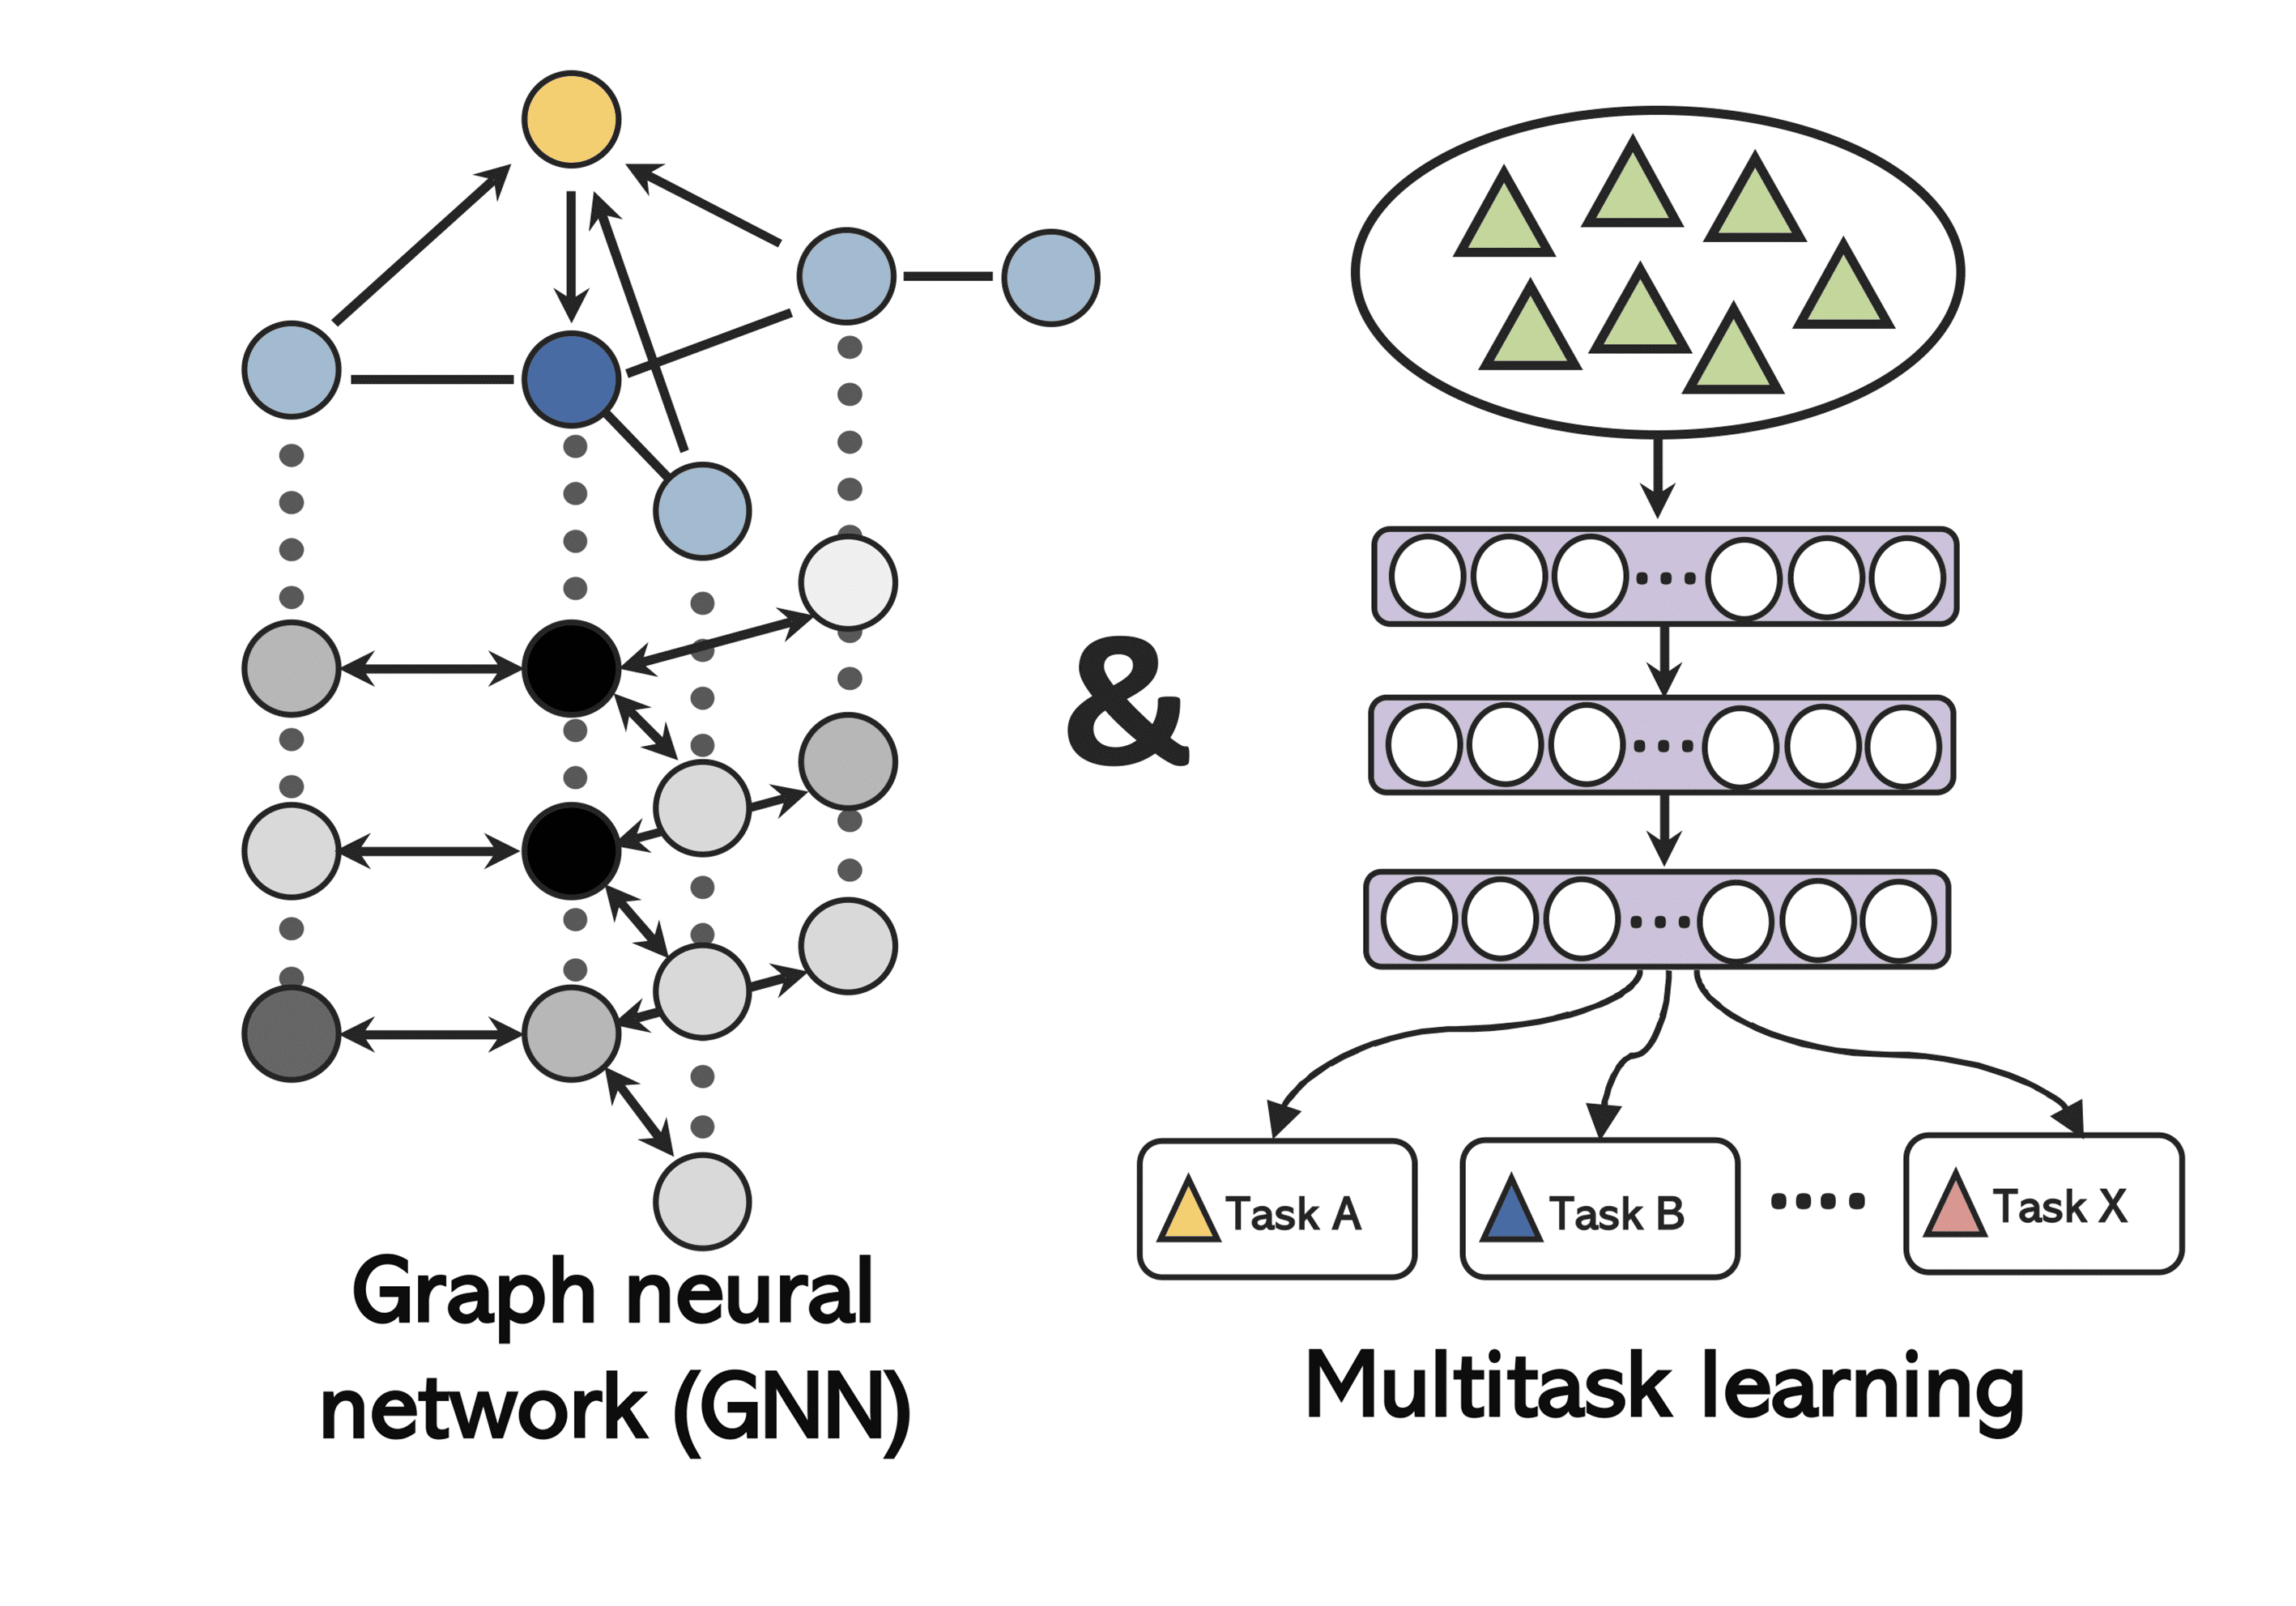
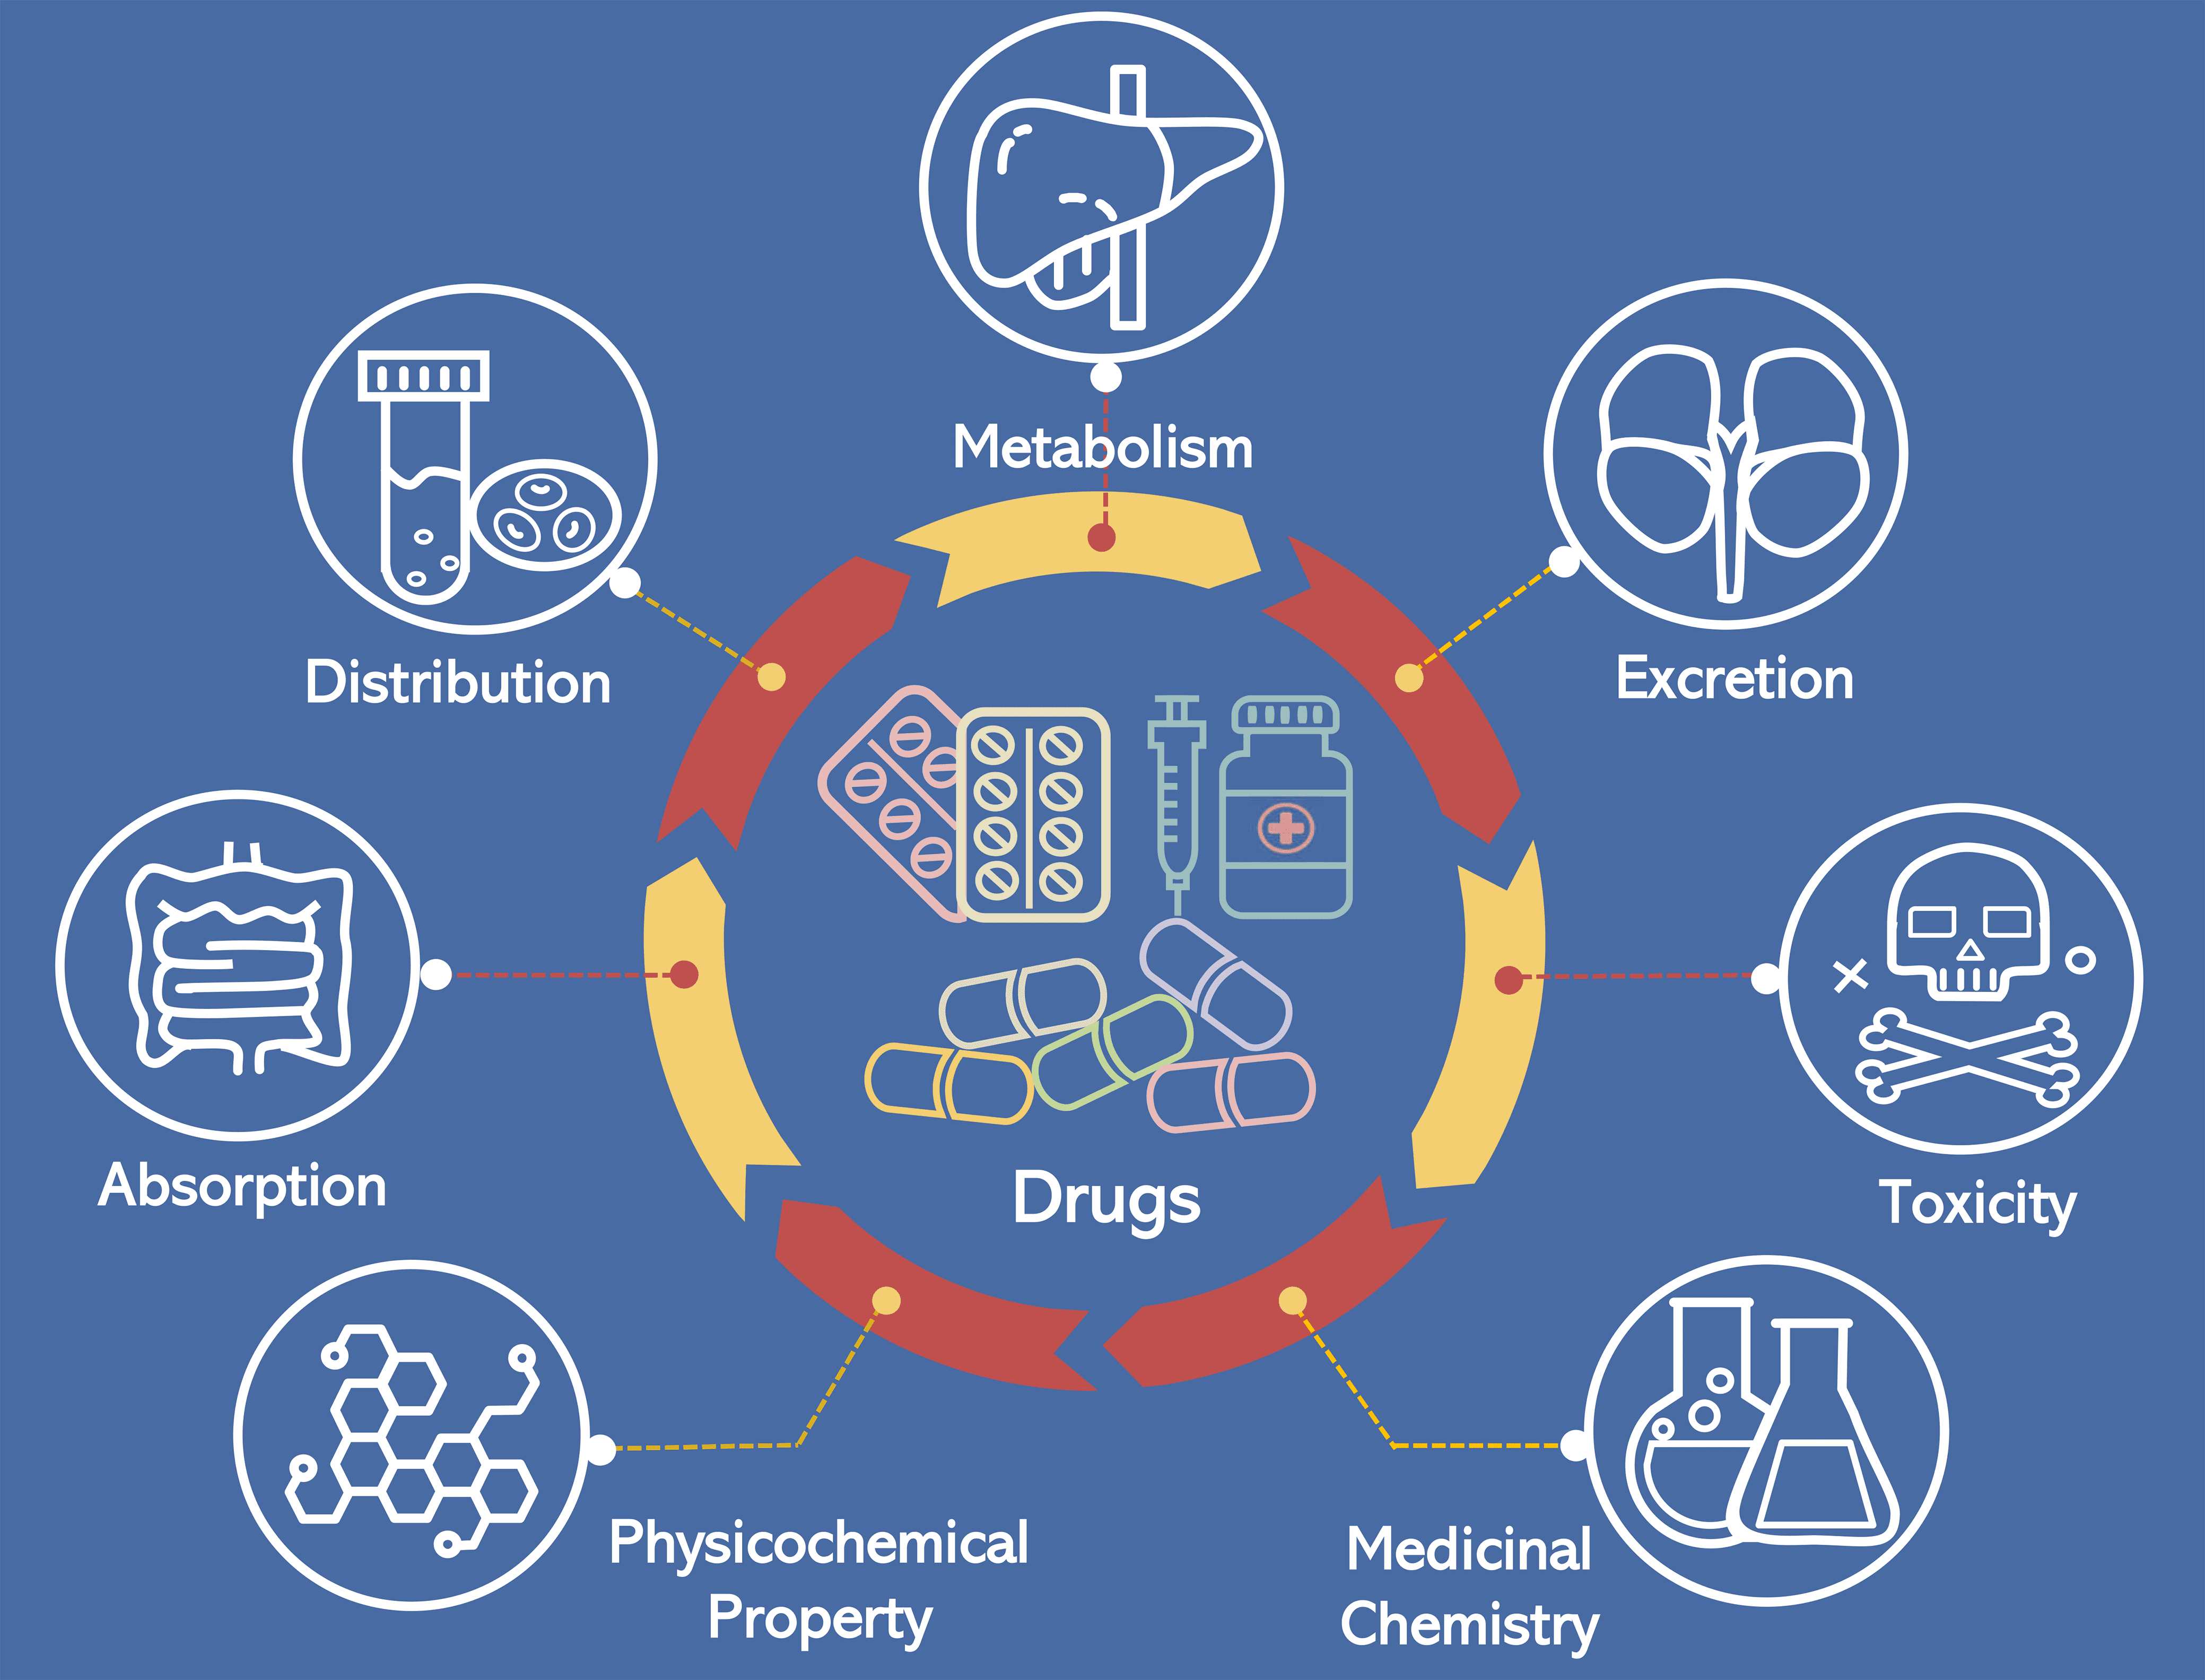
ADMET Evaluation function module is composed of a series of high-quality prediction models trained by multi-task graph attention framework. It enables the users to conveniently and efficiently implement the calculation and prediction of 17 physicochemical properties, 13 medicinal chemistry measures, 23 ADME endpoints, and 27 toxicity endpoints and 8 toxicophore rules (751 substructures), thereby selecting promising lead compounds for further exploration.
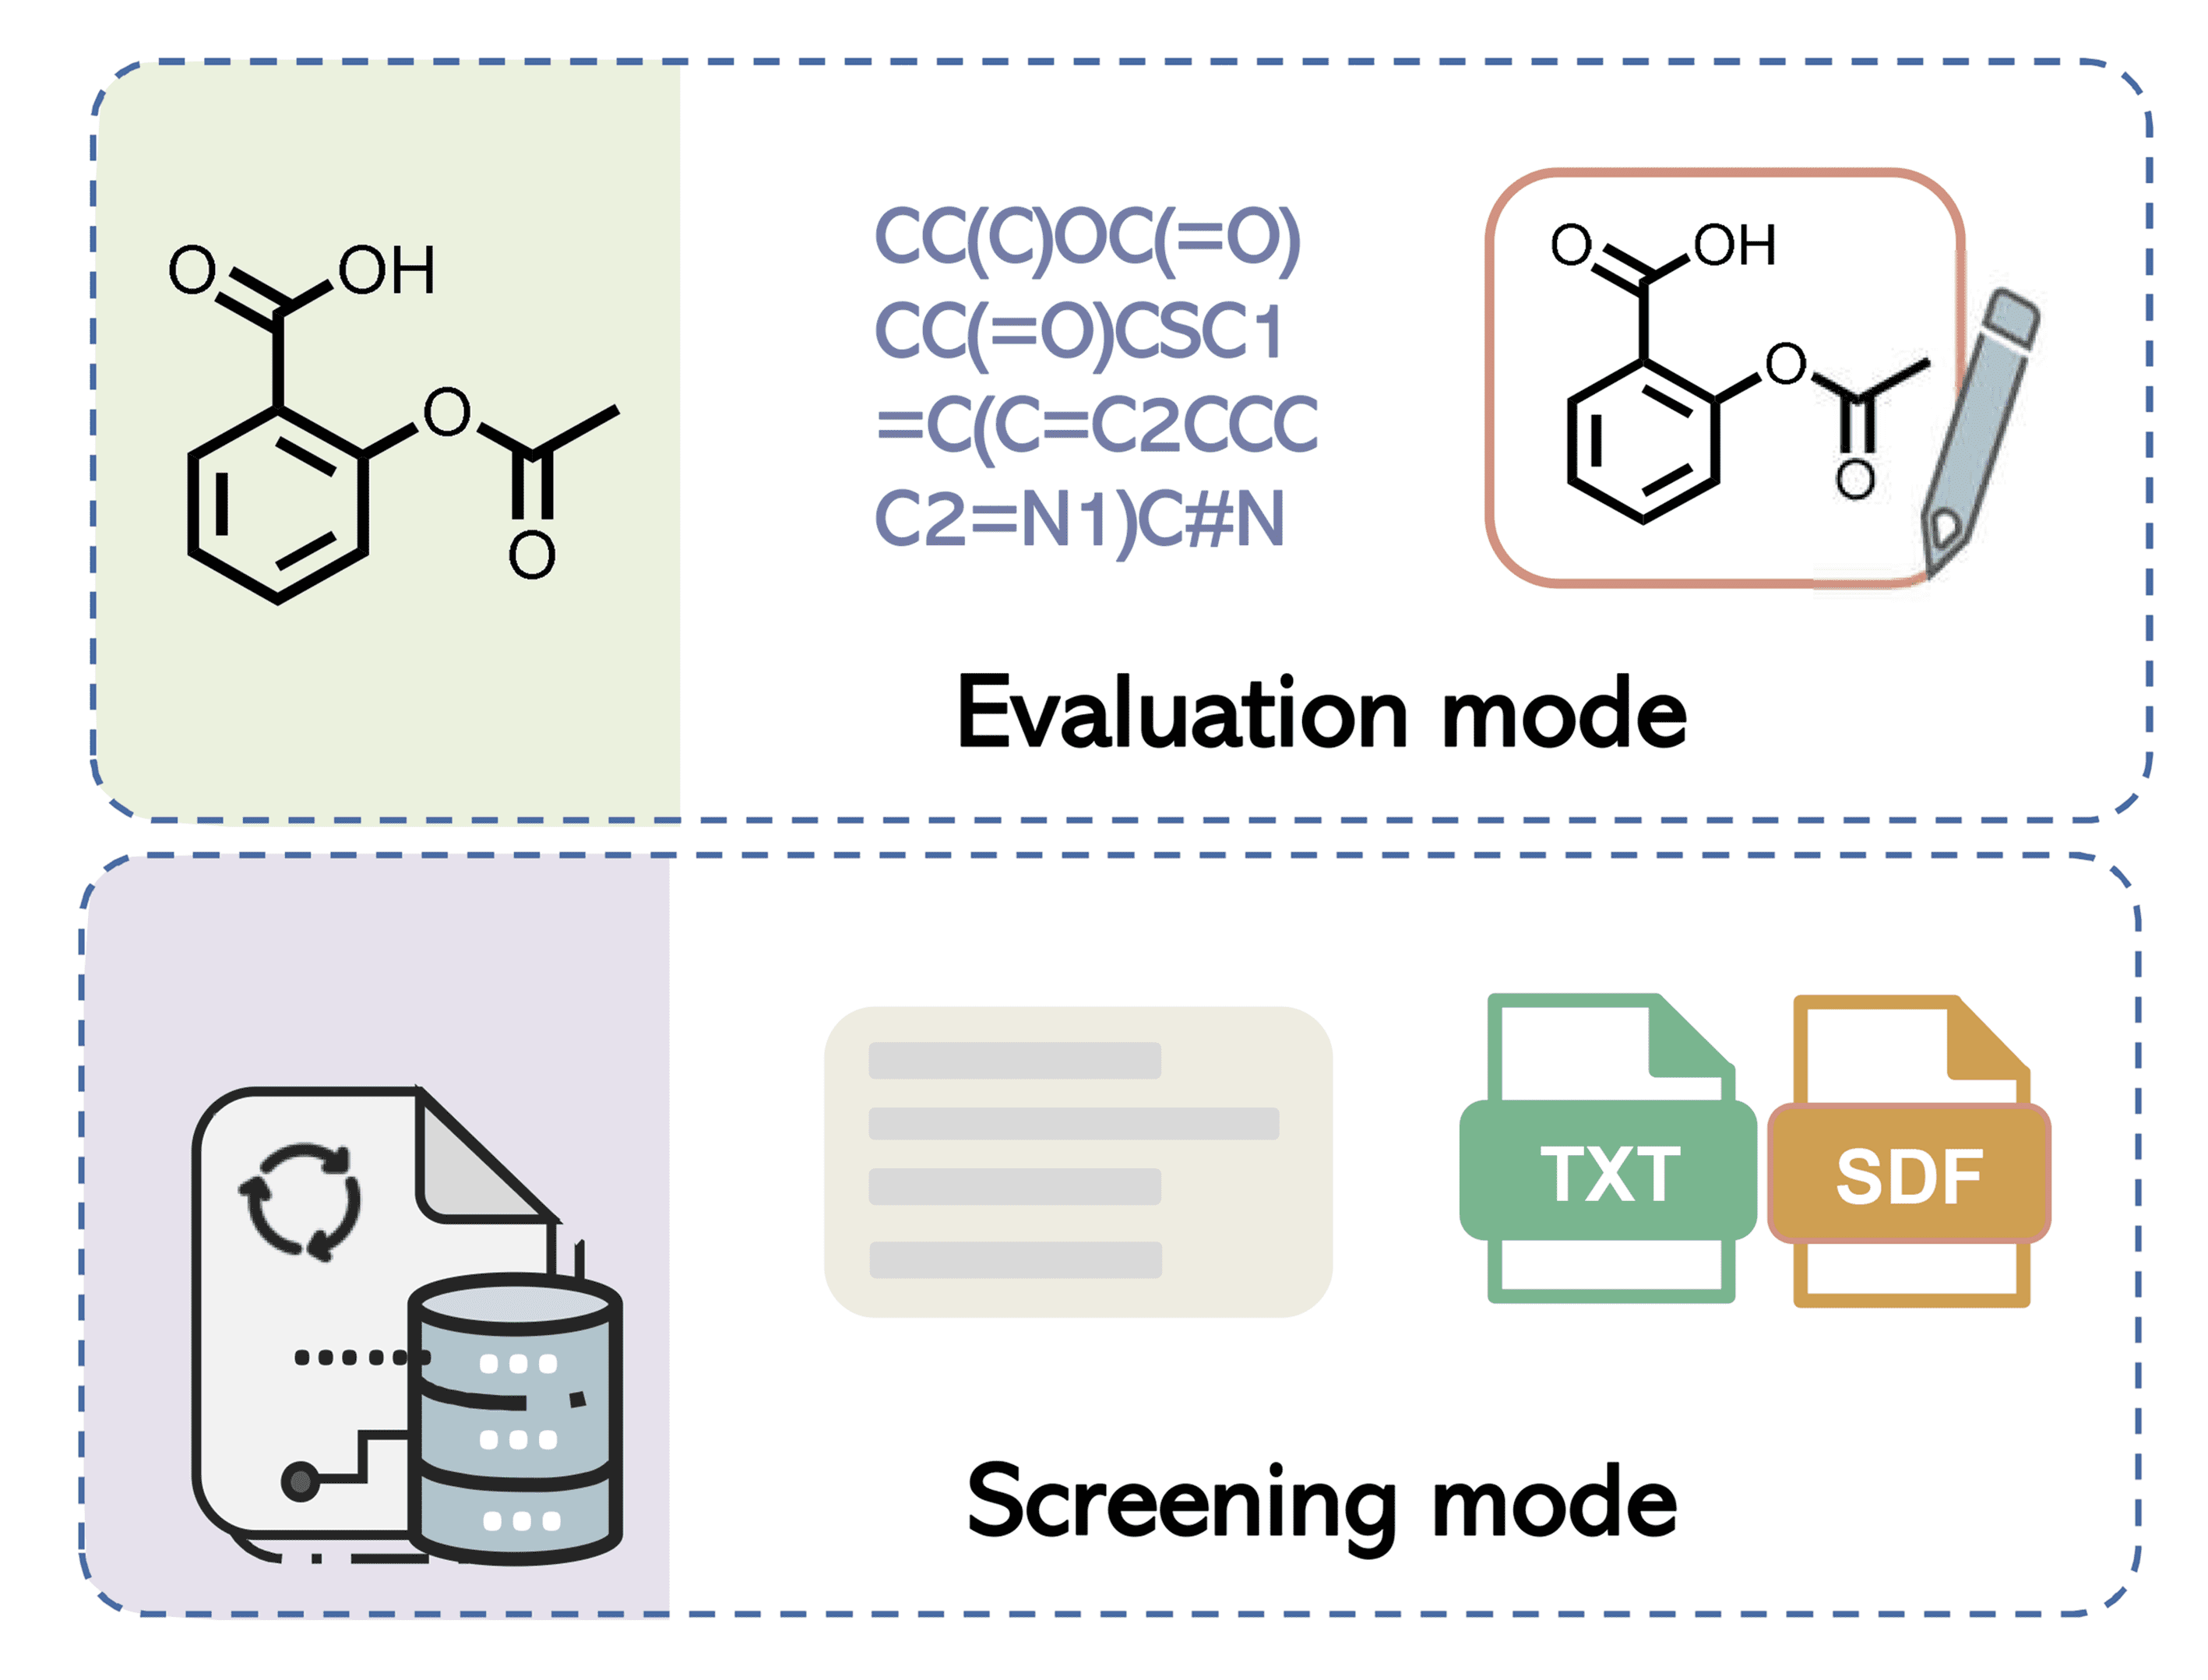
ADMET Screening

ADMET Screening is the batch mode of evaluation, designed for the prediction of molecular datasets. SMILES strings and SDF/TXT formatted files are supported molecular submission approaches. This module is suitable for the evaluation of empirically designed or visually screened molecules before chemical synthesis and biochemical assays, which allows scientists to better focus their experiments on the most promising compounds.

NEW DEVELOPMENTS

Comprehensively enhanced ADMET profiles

In this update, the available ADMET profile is extended to 88 related characteristics spanning 7 different categories, roughly twice the number of its predecessor. Compared with the initial version, the number of entries for model training in the current release has almost tripled.

publications
Re-engineered modules and batch evaluation support

The functional modules were re-engineered and optimized to improve the user experience. An independent module has been added for supporting batch uploading and downloading. The users could define their own criterion to promising and desirable molecules.

publications
Robust and accurate MGA models

The MGA framework was employed to develop classification and regression predictors simultaneously. Deep learning makes multitask learning very natural and the combination leads to improved performance for many modeled endpoints.

publications
Practical explanation and guidance

Detailed explanation and optimal range of each property are provided to help the users to get a whole ADMET picture of input molecule. The empirical-based decision states of each property are visually represented with different colored dots (green: excellent; yellow: medium; red: poor).

publications